
Model-Based Football Predictions Explained (xG, Elo, and What a Model Can’t Know)
Model-Based Football Predictions: How xG and Elo Work
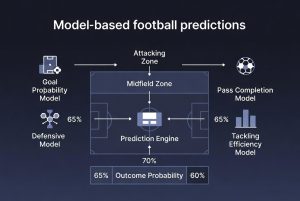
Model-based football predictions convert historical evidence into probabilities rather than certain outcomes. xG estimates the quality of recorded shots, while Elo tracks relative team strength through results and opponent quality. Together, they can strengthen a pre-match baseline, but neither fully captures lineups, tactical changes, red cards, game state or late team news.
What xG and Elo Actually Measure
xG and Elo answer different questions. Expected goals estimates the quality of recorded shots. Elo estimates a team’s relative strength from previous results and opponent quality. Neither metric independently predicts every event that can decide a football match.
| Metric | Main input | Main output | Best use | Main limitation |
|---|---|---|---|---|
| xG | Shot location, angle, body part, assist type and other shot features available to the provider. | A probability that each recorded attempt becomes a goal. | Evaluating chance creation and prevention beyond the final score. | Standard xG evaluates shots, not every dangerous attack that fails to produce one. |
| Elo | Match results, opponent ratings and the model’s rating-update rules. | A relative team-strength rating that changes after each result. | Building a stable long-term estimate of team quality. | Elo may react slowly to injuries, transfers, tactical changes or sudden loss of form. |
This page explains common football-model concepts. It does not claim that every Odds2Win prediction uses an identical formula, data provider or weighting system.
How Expected Goals Works
Standard pre-shot xG assigns a scoring probability to each attempt by comparing it with similar historical shots. A close-range central attempt will normally receive a higher value than a difficult shot from distance or a narrow angle. Exact inputs and weightings vary between data providers.
A Simple xG Example
Suppose a team creates attempts worth 0.10, 0.25 and 0.35 xG.
0.10 + 0.25 + 0.35 = 0.70 xGThis does not mean the team was required to score 0.70 goals. It means comparable chances would produce about 0.70 goals on average across a large sample.
What xG Helps Reveal
- Chance quality: it separates a large number of weak shots from a smaller number of clear opportunities.
- Creation versus finishing: it helps distinguish whether a team produced good chances or converted difficult attempts.
- Defensive performance: xG conceded can show whether a defence repeatedly allowed high-quality opportunities.
- Scoreline context: it provides more information than goals alone when reviewing a match.
What xG Does Not Fully Capture
xG is not a complete measurement of attacking performance. A dangerous pass across goal that narrowly misses every attacker may create no recorded shot and therefore no standard xG value. Tactical control, pressing quality, positioning and game-state effects require separate analysis.
Providers can assign different xG values to the same match because they use different event data, shot definitions and model features. Comparing values from one consistent source is generally more useful than mixing several providers.
How an Elo Football Rating Works
Elo is a continuously updated team-strength rating. A team gains rating points after performing better than expected and loses points after performing worse than expected. Defeating a highly rated opponent normally changes the rating more than beating a much weaker opponent.
Important Parts of a Football Elo Model
- Starting rating: the system needs an initial estimate before later results can update team strength.
- Opponent quality: results against stronger teams carry different information from results against weaker teams.
- Update speed: a K-factor or similar setting controls how quickly the rating reacts to each result.
- Home advantage: football models normally require a separate adjustment for the expected benefit of playing at home.
- Draw treatment: a full 1X2 forecast needs a method for estimating draw probability, not only a rating difference.
Where Elo Is Useful
Elo provides a relatively stable baseline when detailed shot or event data is unavailable. It can also reduce overreaction to one surprising score because every new result is interpreted in relation to the model’s previous expectation.
A results-based rating can lag behind real change. A major injury, managerial change, heavy rotation or altered tactical system may affect a team immediately, while the rating adjusts only after new results provide evidence.
Why Models Can Be Useful and Still Miss a Match
A football model estimates a distribution of possible outcomes. It does not identify one result that must happen. If a team is assigned a 60% win probability, the remaining 40% still represents draws and defeats.
Events That Can Change the Baseline
- Late lineup news: missing a goalkeeper, central defender, playmaker or leading scorer can materially change the match. Read more about how verified team news can change football probabilities .
- First goal: scoring first can alter possession, pressing behaviour, defensive risk and transition frequency.
- Red cards: an early dismissal can invalidate assumptions based on eleven-versus-eleven football.
- Set-piece swing: one corner or free kick can decide a low-scoring match even when open-play control favours the other team.
- Finishing and goalkeeping variance: a team can create better chances and still lose.
A useful model should not be judged only by whether its highest-probability outcome won one match. It should be assessed across a large set of forecasts.
How Model Quality Should Be Evaluated
Accuracy alone can be misleading. A model that repeatedly chooses favourites may record many correct selections without producing well-calibrated probabilities. Strong evaluation considers both the outcome and the probability assigned before the match.
A small difference between a model probability and a market probability may fall inside normal model error. It should not automatically be treated as a meaningful betting advantage.
From Model Probability to Decimal Odds
A model probability can be converted into model-implied decimal odds before bookmaker margin:
model-implied odds = 1 ÷ probabilityA 50% probability corresponds to decimal odds of 2.00. A 40% probability corresponds to 2.50. These figures describe the model’s estimate, not a guaranteed fair market price.
Why Bookmaker Margin Matters
The implied probabilities of all bookmaker prices in a market commonly add up to more than 100%. The amount above 100% represents the market margin. A direct comparison between one model probability and one displayed price should therefore account for the margin and for uncertainty in the model itself.
Video Summary
The video summarises the difference between probability and certainty, xG as a shot-quality measure and Elo as a long-term team-strength rating.
Read the Video Summary
Football models do not identify a guaranteed winner. They estimate how frequently each possible outcome should occur when comparable matches are considered across a sufficiently large sample.
Expected goals evaluates the probability that recorded shots become goals. Elo works differently: it updates a relative team-strength rating according to results and opponent quality.
Both methods have limitations. Late lineup changes, tactical decisions, red cards, game state, set pieces and finishing variance can all cause one match to differ from the pre-match baseline.
Practical Checklist Before Using a Prediction
- Confirm whether the forecast uses current lineups or only historical team data.
- Check whether the model includes home advantage, draw probability and competition strength.
- Compare xG values from the same provider rather than combining incompatible sources.
- Review injuries, suspensions, rotation and schedule congestion before kickoff.
- Separate the probability of an outcome from whether the available price sufficiently compensates for risk.
- Avoid judging the model from one match; review calibration and performance across a large sample.
Frequently Asked Questions
Is xG the same as an expected final score?
No. Match xG describes the combined quality of recorded chances. It does not mean the final score should equal the xG totals, and it does not guarantee how many goals will be scored.
How does Elo differ from xG?
Elo estimates relative team strength from results and opponent quality. xG evaluates the scoring probability of recorded shots. They measure different parts of football performance.
Why do different websites publish different xG values?
Providers may use different event data, shot definitions and model features. Their numbers can therefore differ even when they analyse the same match.
Can a model include late injuries and lineup changes?
Only when those inputs are collected, verified and added before the forecast is updated. A model based on earlier information may not reflect late team news.
How should model probabilities be interpreted?
Treat them as estimates with uncertainty. Compare the assumptions, current team news and market price, and evaluate performance across many predictions rather than one result.
Sources and Methodology References
The explanations on this page are based on established football analytics and probability-forecasting concepts. Individual providers may use different datasets, variables and model specifications.
- Opta Analytics Football data, performance analysis and expected-goals applications.
- World Football Elo Ratings — About the Ratings An overview of Elo-style rating updates for international football.
- Scikit-learn — Brier Score Loss Documentation for evaluating the accuracy of probabilistic predictions.
- Scikit-learn — Log Loss Documentation for evaluating probability estimates and penalising confident errors.
Final Takeaway
xG is most useful for understanding the quality of recorded chances. Elo is most useful as a stable estimate of relative team strength. Combining the two can create a stronger baseline, but a complete football forecast also needs current lineups, home advantage, tactical context, draw modelling and uncertainty management.
The strongest model is not the one that claims certainty. It is the one that produces tested probabilities, explains its limitations and remains useful across a large sample of matches.
This content is provided for informational and educational purposes only. Betting involves financial risk, and no model, rating or prediction can guarantee an outcome.